Insights / Research / TV vs Smartphone: How Netflix viewing changes by device
Research / 23rd May 2022
Peak TV is a collective activity. While there are many blueprints to social viewing, perhaps the most iconic image goes as follows… Family gathers in the living room. Kids fight about everything from the best seat to the remote. Everyone sings along to the adverts they pretend to hate. Family favourite show finishes. All family members want to view something different. What happens next? In the past, most likely a family argument – now there’s a new option. People turn to the mini-screen that keeps them company throughout the day either in the hand, on their desk or their pockets. Entertainment is the smartphone.
Enter – the era of devices.
Chances are, every adult (and some children) in your household has their own smartphone. Those too young for phones have tablets, and computers are used daily, not just for work. It is now possible for each member of a household to watch a different show, in different rooms on different devices. A proportion of viewing isn’t even taking place within the house any more. The office break room, the train, the bus, a friend’s house, a plane, in a waiting room, anytime when you’re out and about with nothing to do, chances are – you’ll at least think about watching something on your phone.
Entertainment is portable and accessible at all times and in all places, as long as you have a smartphone.
The viewing revolution is not just about a change in the way we consume content, or the content we consume, but also where we access content. Smartphones are an individual TV screen in which you can choose exactly what you want to watch without fear of annoying others or embarrassing yourself in front of others by your choice of viewing.
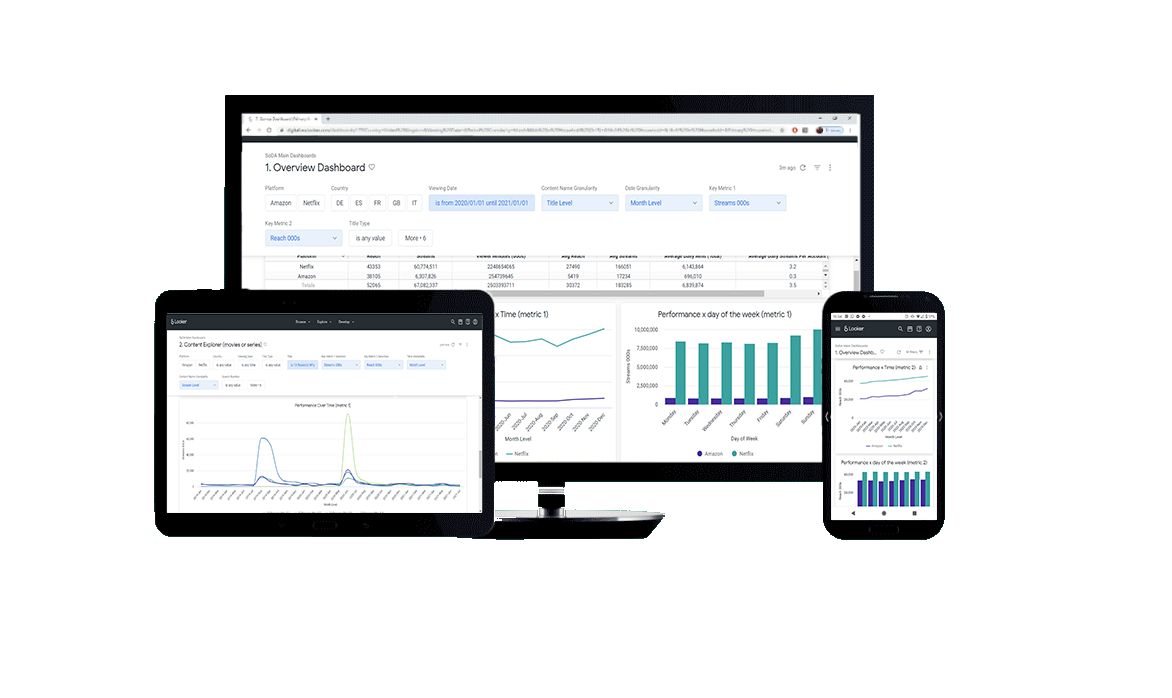
We often cite big TV events and family viewing as important social bonding moments. However little is said or written about solo small-screen viewing. Now, with SODA’s latest enhanced device analysis feature we can begin to understand how viewing differs across devices.
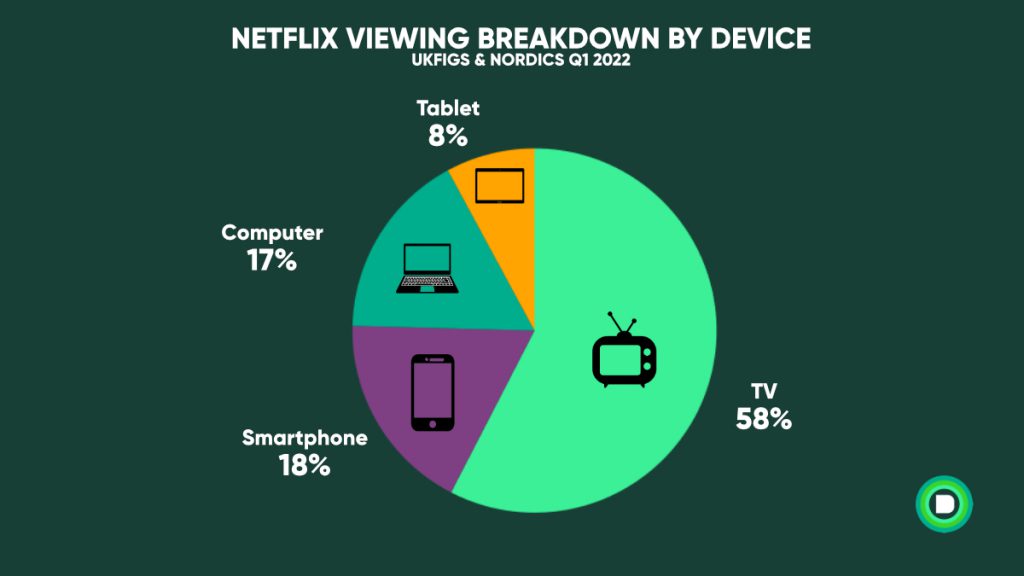
Starting with the most popular and commonplace devices: the TV vs the smartphone.
Using the latest feature in SoDA, our in-house SVOD audience measurement and analytics platform, we analysed viewing by device-in-use in European territories. Through this analysis we discovered a number of important insights that will directly influence content scheduling, recommendation algorithms and ad-tier SVOD strategy.
Unsurprisingly, Netflix watched through a TV follows linear TV daypart viewing patterns. Peak viewing occurs between 8pm and 10pm (depending on country of residence). During these peak hours, over 60% of all Netflix viewing is watched through a TV or other devices which are usually linked to a TV. For the purpose of our analysis consoles, streaming devices and set-top boxes have all been attributed to TV viewing.
In the early hours of the morning only around 40% of all Netflix viewing occurs on a TV. At the same time, 30% is watched through a smartphone.
Throughout the day, viewing splits across device-in-use in waves. We can see an early-morning pick-up in Netflix viewing via tablets. The dip in smartphone viewing that coincides with a steady ride in computer usage and peak Netflix TV time.
Understanding how Netflix viewing splits across devices throughout the weekday is a crucial part of understanding SVOD viewer behaviour. Without truly knowing your audience, how and when they look to access your content, you’ll be missing out on golden opportunities to display your products in the right place at the right time.

Not only is the way we consume different by device, but there are key differences in what we view.
By comparing the top lists of Netflix content viewed on TV and smartphones, we created an indexing system. We ranked the top 500 Netflix titles from Q1 2022 on smartphones and TVs and plotted the results. By combining these datasets, we built a picture of the types of viewer behaviour exclusive to smartphone or TV viewing.
Titles that over-index for viewing on TV tend to be children’s content. Sonic the Hedgehog, Gabby’s Dollhouse and The Secret Life of Pets all perform highly for this category. While Peppa Pig ranked 57th in TV viewing, it only ranked 403rd for smartphone viewing. Children and family content is much more popular on the TV than the smartphone.
On the other hand, two main subgenres stood out among the titles that over indexed on smartphones. Content skewed to teen viewing and romantic content especially shows or movies with particularly steamy scenes.
Let’s start with teen content. The teen-focused title which over-indexed the highest for smartphone viewing was Hype House. This show follows the lives of American TikTok stars living in the shared Hype House. It ranked 224 places higher for smartphone viewing (189th) than it did for TV viewing (413th). For a show about teens who made their living on their smartphone, it’s no surprise that this show skews to smartphone viewing.
However, the key category of smartphone-skewed viewing was content featuring graphic sex or sex as a key theme. The most salient example is the Polish erotic thriller, 365 Days. The film ranked 292nd for TV viewing over the time period, but for smartphone viewing shot all the way up to 11th. Additionally, 50 Shades of Grey ranked 296 places higher for phone viewing over TV viewing.

So why do we view certain types of content in completely different ways?
The analysis shows that kids and families normally watch their content on TVs. This can indicate a level of co-viewing or at least over-sight of children’s viewing habits. What does this mean? That content-creators on streamers need to bear in mind adult viewing just as much as linear TV kids networks do. It also means that streaming platforms need to recognise the parental desire to be able to see what their children are watching.
The inverse trend supports the former. Audiences watch potentially ’embarrassing’ content on their phones. This could be content of a graphic nature, or even content created for a younger age group (e.g. teen dramas). Further study is needed to clarify the nature of this trend. But it looks like smartphones act as a safe and private place for viewers to explore their preferences without fear of judgment.
Our granular data, doesn’t just tell you what people are doing, it opens the door to start to understand the ‘why’, to know what questions to ask in qualitative studies, and to truly know your audience.
As the viewing revolution rages on and the streaming wars takes a new turn – understanding the ways in which viewers interact with streamed content should be at the top of your priority list.
By segmenting viewing with device-specific data, you can unveil insights into audience behaviour and device-specific viewing trends. As Netflix and others consider ad-based models, a deep understanding of these differences will be vital to create the best ROI for advertisers.
In the coming weeks, we will be pushing more new features live to SoDA. If you want to find out more about our devices breakdown, or about SoDA please get in touch here.
Know your audience.
Join the viewing revolution.
Speak to an expert to find out how our intelligence platform will revolutionise your TV reporting & SVOD research